Customer Segmentation Visualization with Paraview
by. Jongwon Lee | 275 Views (188 Uniq Views) | about 4 years ago
#TermPaper #DataVisualization #ScientificVisualization #Paraview #Economics
Term Paper for Scientific Visualization ENGR-E584, Indiana University
- 목표 및 문제 정의: 3D 시각화 기법을 활용하여 고객 세분화 인사이트를 향상시키고, 고객 분류에 영향을 미치는 주요 요인을 식별. 머신러닝 기법과 2D시각화 분석의 한계를 3D로 확장하여 추가적 인사이트 도출.
- 주요 수행 내용:
- 데이터 분석 및 시각화
- Python과 머신러닝 기법을 사용하여 8,000개 이상의 고객 행동 데이터를 전처리하고 분석.
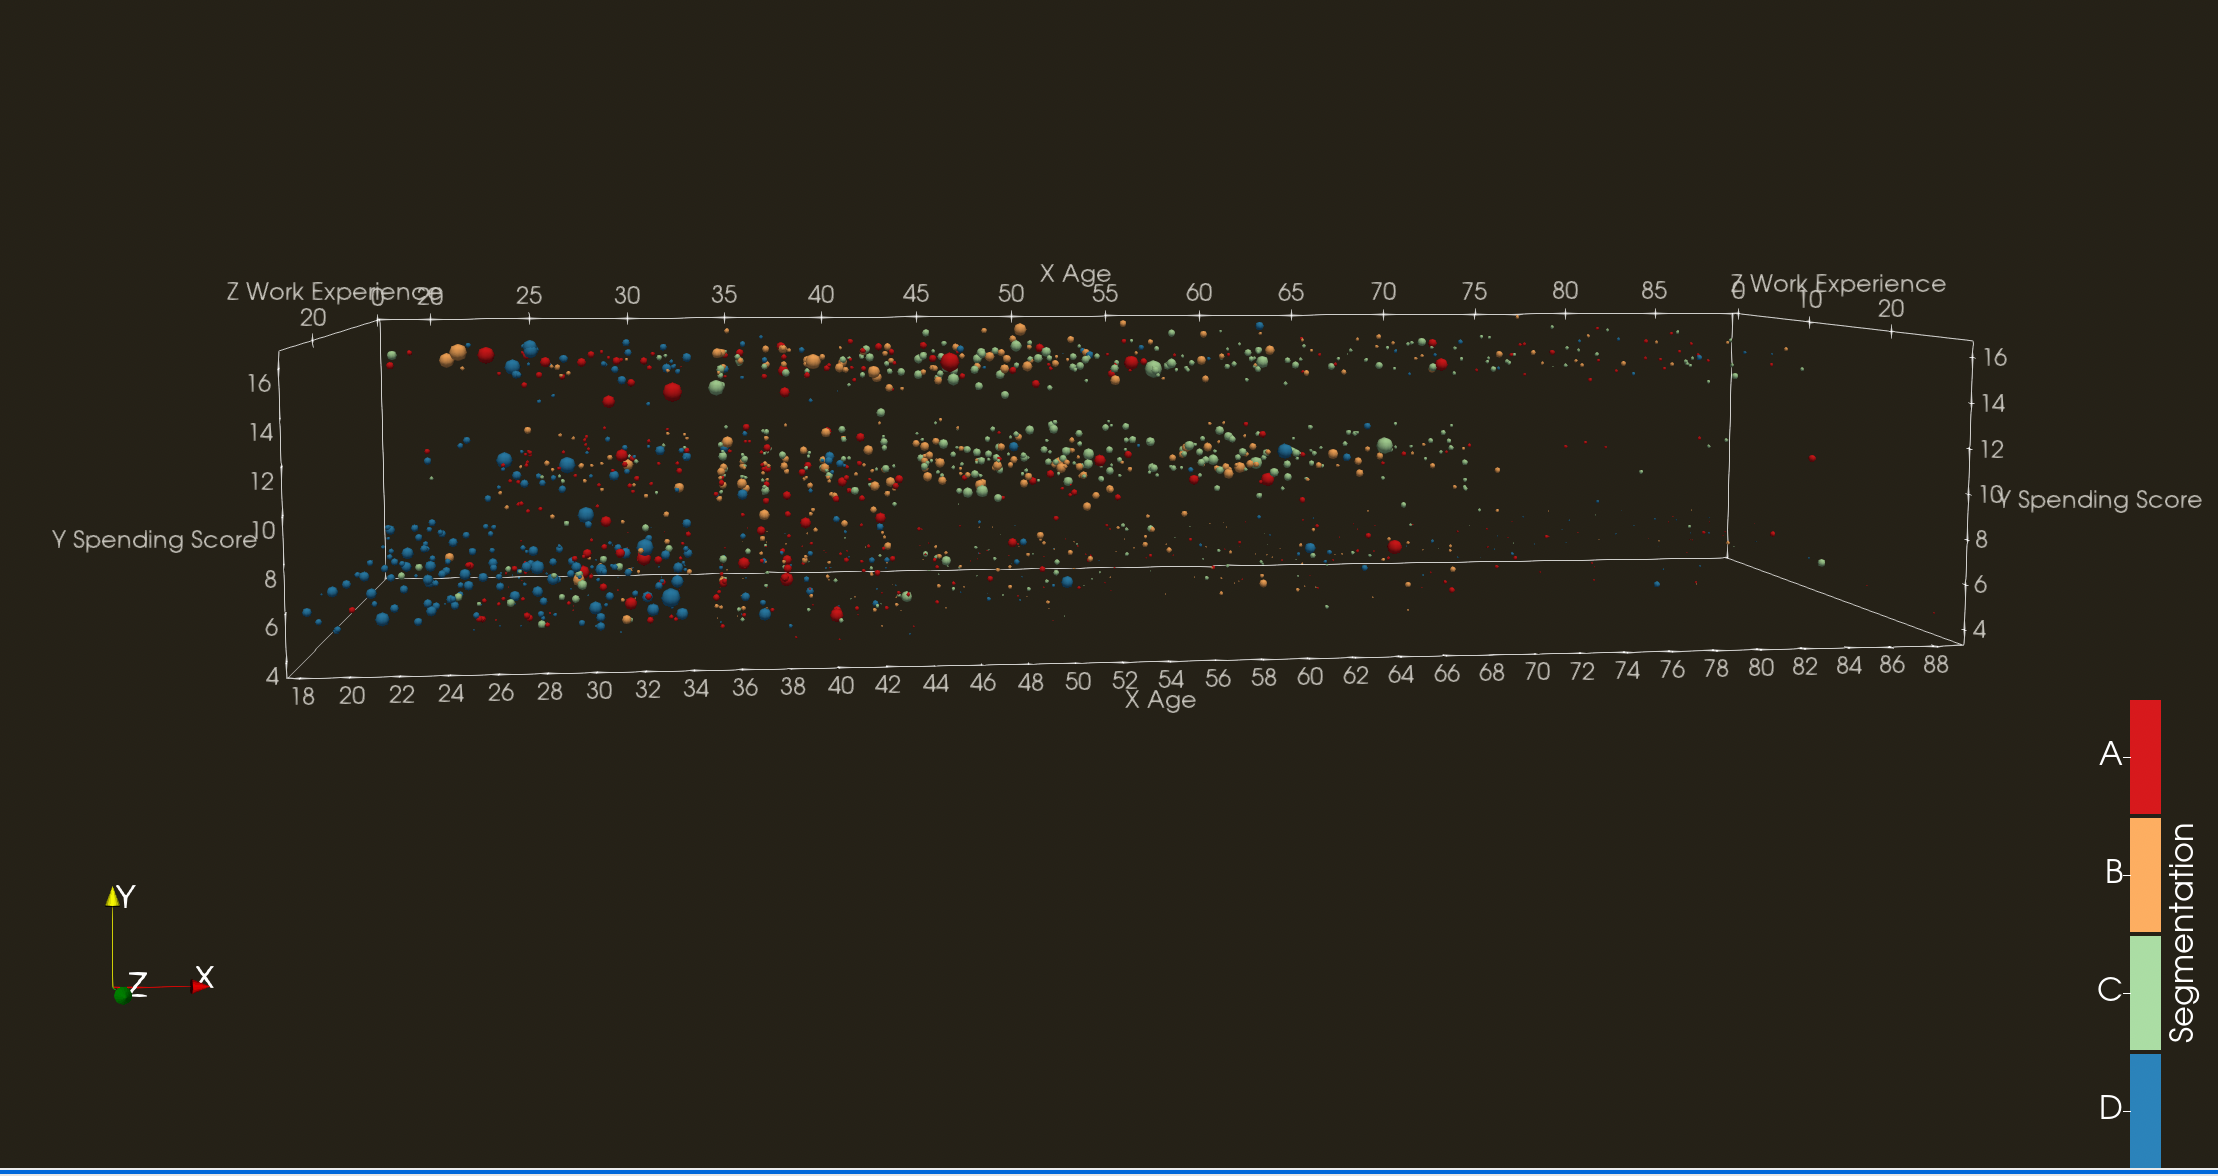
- Paraview를 사용해 3D 시각화해 인사이트를 분석하고, Sketchfab을 통해 인터랙티브하고 접근성이 우수한 3D 모델을 임베드.
- 결혼여부, 나이 등이 유의미한 변인이었으나 성별 경력 등은 상대적으로 유의미 하지 않음을 3D 시각화 모델로 설명.
- 결과 분석 및 성과:
- 마케팅 팀과 이해관계자들이 2D 시각화나 머신러닝에 의존한 분석보다 직관적인 데이터 기반 인사이트를 제공.
- 데이터 분석 및 시각화
Abstract
We describe a series of trials on visualizing information data on Paraview which is mainly used for scientific visualization of 3D objects such as geographic, microscopic, architectural, etc. With Information Visualizations done in 3D space, we aim to derive insights focusing on determining which factors are significant on the topic of customer segmentation. According to the analysis of visualization, we found Ever_Married, Age, Graduated, Profession, and Spending_Score were significant for customer segmentation, and Gender, Work_Experience, and Family_Size were less significant. In addition, we identify challenges related to limited data types, exporting axis and legends, and displaying the visualization with interactivity.